28 January 2023, IELTS Exam, Writing Task 1, Morning Slot, INDIA
Actual IELTS Exam, Academic, Morning Slot, Writing Task 1, 28 January 2023, INDIA
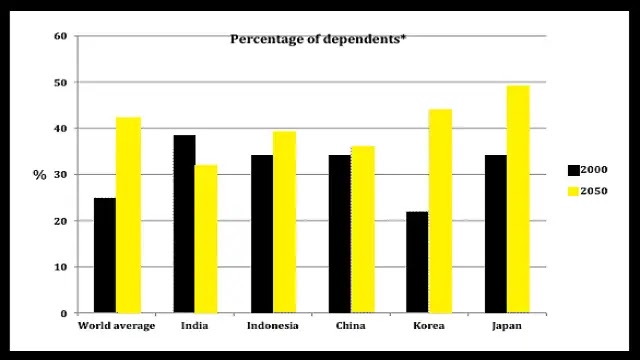
Q. The graph below shows the percentage of dependents in 2000 and the predicted figures in 2050 in five countries, and also gives the world average.
The given vertical bar graph illustrates the proportion of dependents in five countries in 2000 and also provides projections for 2050. It also depicts the global average for the two years.
In 2000, India had the highest proportion of dependents (38%) followed by Japan, Indonesia and China with about 34% of dependents. Korea had the lowest proportion of reliant people (22%). The total world population of children under 15 and adults over 65 was 25%.
Looking into the future, an increase in the population of dependents is predicted for Indonesia, Korea, China and Japan. In contrast, the needy population in India is projected to fall from 38% to 32%. The population in Korea is expected to double from 22% to 44% by 2050. An approximately 15% increase in such population is projected for Japan, while China is thought to show the lowest increase (2%). Dependents are expected to increase from the world average of about 25% to about 42%.
Overall, it is crystal clear that the dependency rate is expected to decrease in India, while it is projected to increase in the other four countries.
👉Click Here For More Recent IELTS Exam Reading Tests


Leave a Comment